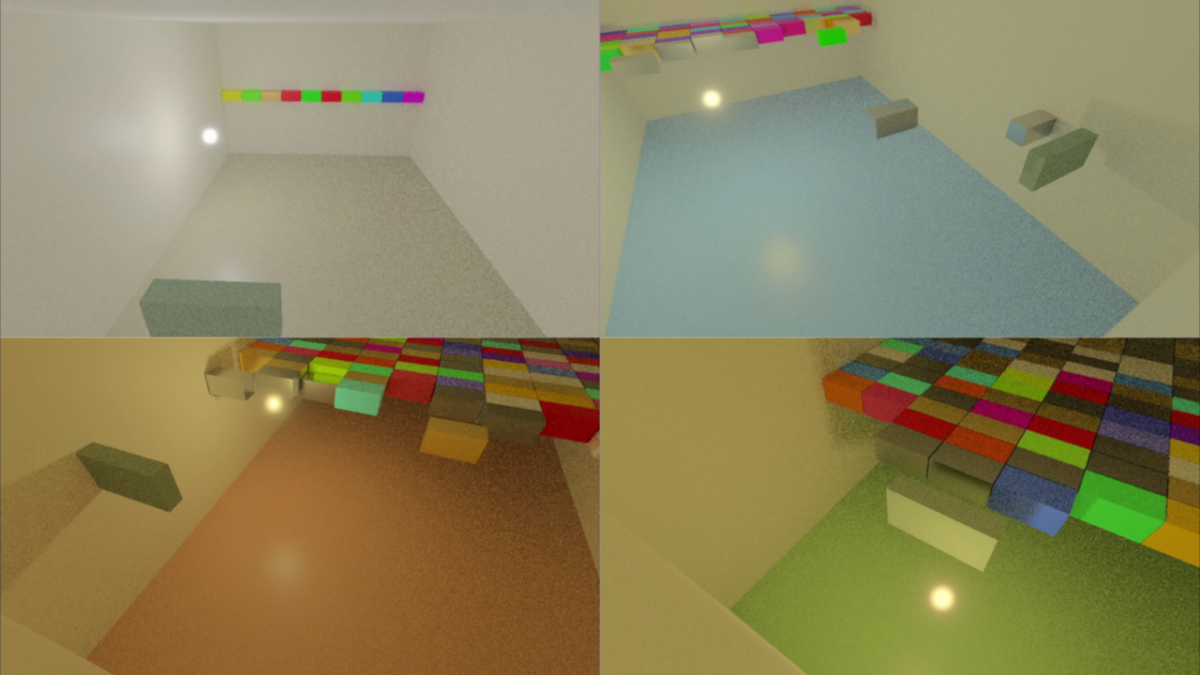
I have made a new video that shows lighting changes (luminance and color temperature) throughout the course of a single playthrough of the real-time path tracing game that I am working on:
Category: Programming
Posts relevant to software programming
Game Design
I have made a video talking about the gameplay and design of the current real-time path traced game that I am working on:
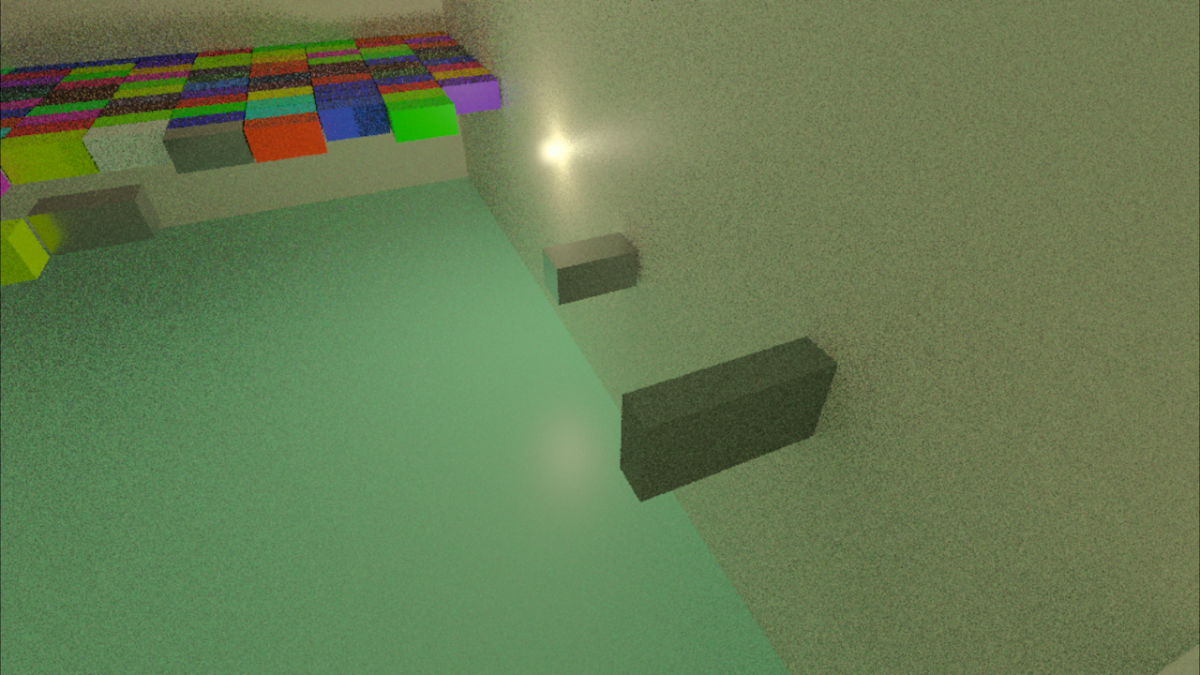
Indirect Lighting Example
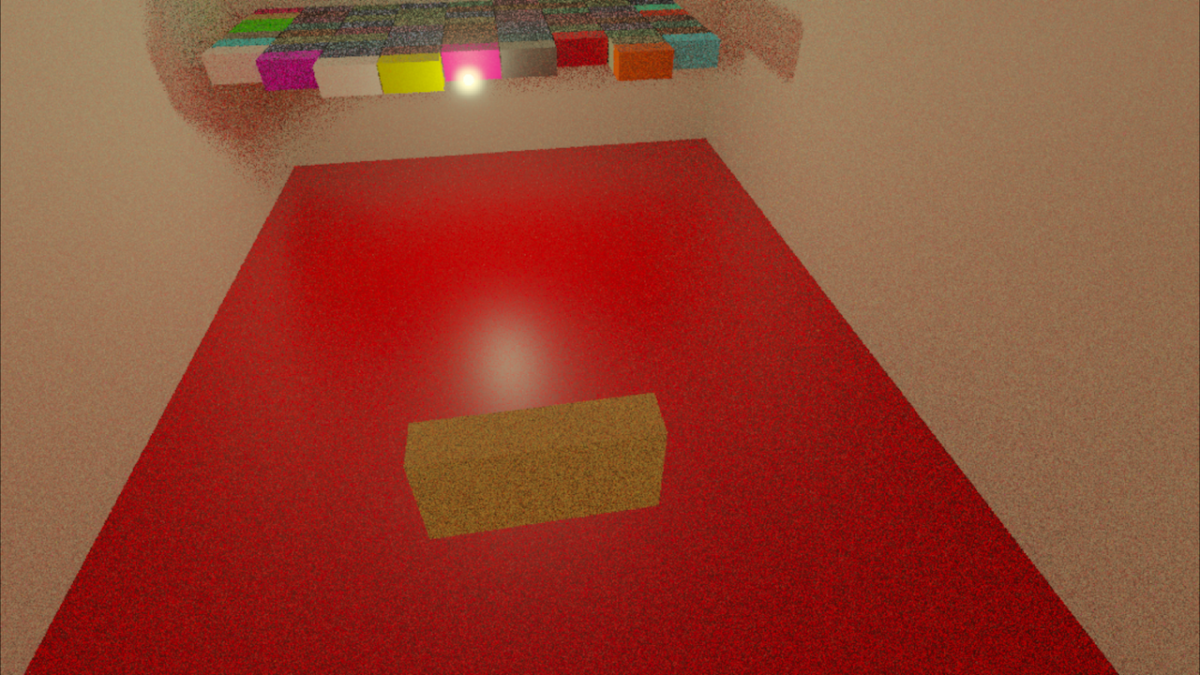
I have published a video that shows a game that I have been working on. In its current state it shows a pretty good example of the effect that indirect lighting can have when the floor changes colors:
Reflections in my Real-Time Path Tracer
I made a video showing real-time reflections that I have added to my path tracer:
This uses the same room (based on a real one in my house) that the previous video did but with reflections added. I also thought that spheres would be a better way for a viewer to understand reflections than rectangular blocks and so I implemented the ability to have interpolated shading normals.
One thing that I always like in papers is when there is a row of spheres with some progressively-varying difference in a material property. I only had room for three spheres in a row for the size of spheres I wanted and the narrow room in my house, but it was fun to at least create a miniature version of the kind of diagram that I always enjoy seeing.
Antialiasing Raytracing
I wanted to try and see what it looked like to only have a single primary ray for each pixel but to change the offset of the intersection within that pixel randomly every frame. The results have to be seen in motion to properly evaluate, but below is an example of a single frame:
A gif also doesn’t properly show the effect because the framerate is too low, but it can give a reasonable idea:
If you want to see it in action you could download the program. The controls are:
- Arrow keys to move the block
- (I to move it away from you and K to move it towards you)
- WASD to move the camera
The program relies on several somewhat new features, but if you have a GPU that supports ray tracing and you have a newish driver for it then the program will probably work. Although the program does error checking there is no mechanism for reporting errors; this means that if you try to run it but it immediately exits out then it may be because your GPU or driver doesn’t support the required features.
Samples and Filtering
In a previous post where I showed ray tracing the rays were intersecting the exact center of every pixel and that resulted in the exact same kind of aliasing that happens with standard rasterization (and for the same reason). This can be fixed by taking more samples (i.e. tracing more rays) for each pixel and then filtering the results but it feels wasteful somehow to trace more primary rays when the secondary rays are where I really want to be making the GPU work. I wondered what it would look like to only trace a single ray per-pixel but to adjust the sample position differently every frame, kind of similar to how dithering works.
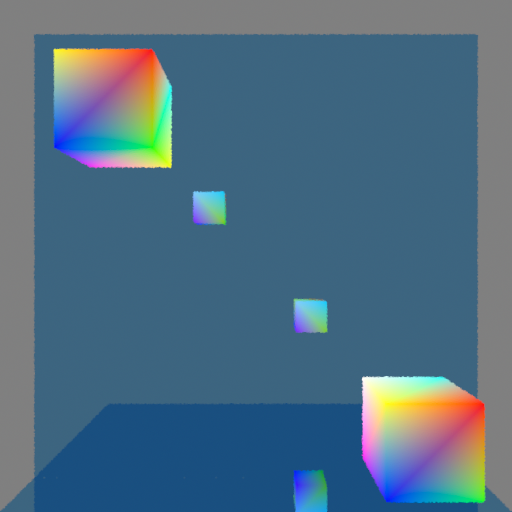
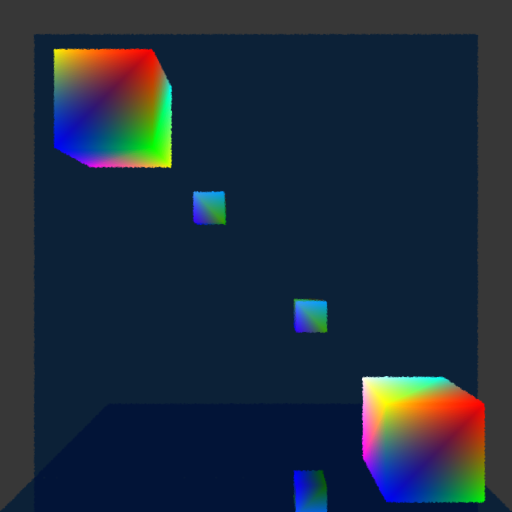
You can see a single frame capture of what this looks like below:

This is displaying linear color values as if they were sRGB gamma-encoded, which is why it looks darker (it is a capture from PIX of an internal render target). Ignore the difference in color luminances, and instead focus on the edges of the cubes (and the edges of the mirror, too, although the effect is harder to see there). Every pixel will only show an intersection with a single object, and if the area around that pixel contains an object’s edge then by changing where the intersection happens in that area sometimes a pixel will show one object and sometimes another object. (Side note: Just to be clear, this effect happens at every pixel and not just edges of objects. If you look closely you might be able to tell that the color gradients also have noise in them. The edges of objects, however, is where the results of these jittered ray intersections are really noticeable.)
In a single frame this makes the edges look bumpy. In a sequence of frames (like when the program is being run) the effect is more noisy; the edges still feel kind of bumpy but the bumpiness changes every frame. I had hoped that it might look pretty good in motion but unfortunately it is pretty distracting and doesn’t feel great.
Even with only a single intersection per pixel, however, it is possible to use samples from neighboring pixels in order to filter each pixel. That means that you could have up to nine samples for each pixel, even though only a single one of those nine samples would actually be inside of the pixel’s area. Let me repeat the preceding screenshot but then also show the version that is using filtering with the neighboring eight pixels so that you can compare the two versions next to each other:
The same bumpiness contours are still there, but now they have been smoothed out. This definitely looks better, but it also makes the edges feel blurry (which makes sense because that is exactly what is happening). The real question is how does it look in motion?
Unfortunately this also didn’t look as good as I had hoped. It definitely does function like antialiasing, which is great, and you no longer see discreet lines of pixels appearing or disappearing as the cubes get closer or further from the camera. At the same time, the noise is more obvious than I had hoped. I think it is the kind of visual effect that some people won’t mind and will stop to notice but that other people will really find objectionable and constantly distracting. Again, if you’re interested, I encourage you to download the program yourself and try it to see what you think!
Is it Usable?
For now I am going to keep it. I like the idea of doing antialiasing “properly” and I think it will be interesting to see how this performs with smaller details (by moving the cubes very far from the camera I can get some sense for this, but I’d like to see it with actual detailed objects). There is also an obvious path for improvement by adding more samples per pixel, although computational expense may not allow that.
I haven’t looked into denoisers beyond a very cursory understanding and so it’s not clear to me whether denoising would make this problem better or whether using this technique would actually inhibit denoisers being able to work well.
I personally kind of like a bit of noise because it makes things feel more analog and real to me, but I realize that this is an individual quirk of mine that is far from universal (as evidenced by the loud complaints I read online when games have added film grain). Although the effect ends up being more distracting than I had hoped (I can’t claim that I would intentionally make it look like this if I had a choice) I still think it could potentially work as kind of an aesthetic with other noise. This will have to be evaluated further, of course, as I add more ray tracing effects with noise and create more complicated scenes with more complicated geometry.
Real-Time Ray Tracing on the GPU
It has been a long-standing goal of mine to program something using the hardware ray tracing capabilities that are now available and I finally have something to show:
I was introduced to ray tracing when I was a student at the University of Utah (my pages for class assignments were up for years and it was fun to go look at the images I had rendered; sadly, they eventually got removed and so I can’t link to them). At the time there was a lot of work being done there developing real-time ray tracers (done in software but not with the help of GPUs) which was really cool, but after I graduated I moved on to the games industry and although I never lost my love of ray tracing I don’t know that I ever did any further personal projects using it because I became focused on techniques being used in games.
When the RTX cards were introduced it was really exciting but I still had never made the time to do any programming with GPU ray tracing until now. It has been both fun and also gratifying to finally get something working.
Reflections
I first got ray tracing working a few weeks ago but I haven’t written a post until now. The problem was that the simple scene I had didn’t look any different from how it did when it was rasterized. Even though I was excited because I knew that the image was actually being generated with rays there wasn’t really any way to show that. The classic (stereotypical?) thing to do with ray tracing is reflections, though, and so I finally implemented that and here it is:
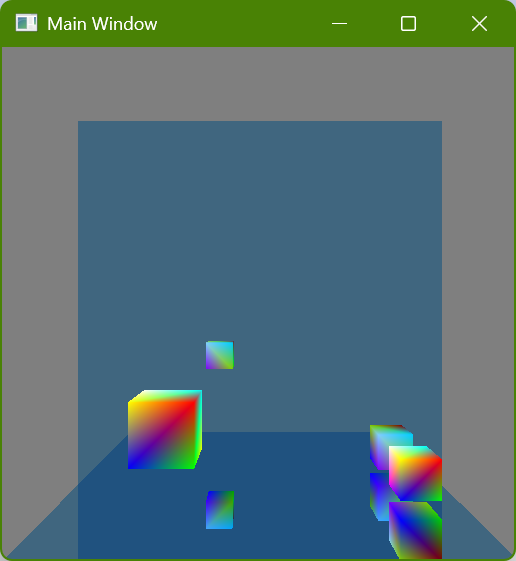
There are two colorful cubes and then a mirror-like wall behind them and a mirror-like floor below them:

I initially just had the wall mirror but I realized that it still showed something that could be done with rasterization (by rendering the scene a second time or having mirror image geometry, which is how older games showed mirrors or reflective floors) and so I added the floor mirror in order to show double reflections which really wouldn’t be seen with rasterization. Here is a screenshot where a single cube (in the lower-right corner) is shown four times because each reflective surface is also reflecting the other reflective surface:
Implementing Hardware Ray Tracing
One of the nice things about ray tracing compared to rasterization is how simple it is. The more advanced techniques used to make compelling images are harder to understand and require complexity to implement, but the basics of generating an image are quite straightforward and pretty easy to understand. I wondered if that would translate into working with the GPU, and I have good news but also bad news:
The Good News
The actual shaders that I wrote are refreshingly straightforward, and the code is essentially the same kind of thing I would write doing traditional CPU software ray tracing. I am using DirectX, and especially when using dynamic resource indexing it is really easy to write code the way that I would want to (in fact, with how I am used to working with shaders (which I have discovered is very outdated) I kept finding myself honestly amazed that the GPU could do what it was doing).
The following is shader code to get the normal at the point of intersection. I don’t know if it will look simple because of my verbose style, but I did change some of my actual code a little bit to try and shorten it for this post hehe:
// Get the renderable data for this instance
const StructuredBuffer<sRenderableData> renderableDataBuffer =
	ResourceDescriptorHeap[g_constantBuffer_perFrame.index_renderableDataBuffer];
const sRenderableData renderableData = renderableDataBuffer[InstanceID() + GeometryIndex()];
// Get the index buffer of this renderable data
const int indexBufferId = renderableData.indexBufferId;
const Buffer<int> indexBuffer = ResourceDescriptorHeap[
	NonUniformResourceIndex(g_constantBuffer_perFrame.index_indexBufferOffset + indexBufferId)];
// Get the vertex indices of this triangle
const int triangleIndex = PrimitiveIndex();
const int vertexCountPerTriangle = 3;
const int vertexIndex_triangleStart = triangleIndex * vertexCountPerTriangle;
const uint3 indices = {
	indexBuffer[vertexIndex_triangleStart + 0],
	indexBuffer[vertexIndex_triangleStart + 1],
	indexBuffer[vertexIndex_triangleStart + 2]};
// Get the vertex buffer of this renderable data
const int vertexBufferId = renderableData.vertexBufferId;
const StructuredBuffer<sVertexData> vertexData = ResourceDescriptorHeap[
	NonUniformResourceIndex(g_constantBuffer_perFrame.index_vertexBufferOffset + vertexBufferId)];
// Get the vertices of this triangle
const sVertexData vertexData_0 = vertexData[indices.x];
const sVertexData vertexData_1 = vertexData[indices.y];
const sVertexData vertexData_2 = vertexData[indices.z];
// Get the barycentric coordinates for this intersection
const float3 barycentricCoordinates = DecodeBarycentricAttribute(i_intersectionAttributes.barycentrics);
// Interpolate the vertex normals
const float3 normal_triangle_local = normalize(Interpolate_barycentricLinear(vertexData_0.normal, vertexData_1.normal, vertexData_2.normal, barycentricCoordinates));
The highlighted lines show where I am looking up data (this is also how I get the material data, although that code isn’t shown). In lines 2-3 I get the list of what I am currently calling “renderable data”, which is just the smallest unit of renderable stuff (currently a vertex buffer ID, an index buffer ID, and a material ID). In line 4 I get the specific renderable data of the intersection (using built-in HSL functions), and then I proceed to get the indices of the triangle’s vertices, and then the data of those vertices, and then I interpolate the normal of each vertex for the given intersection (I also interpolate the vertex colors the same way although that code isn’t shown). This retrieval of vertex data and then barycentric interpolation feels just like what I am used to with a ray tracer.
The following is most of the shader code used for recursively tracing a new ray to calculate the reflection (I have put ... where code is removed to try and remove distractions):
RayDesc newRayDescription;
{
	const float3 currentRayDirection_world = WorldRayDirection();
	{
		const float3 currentIntersectionPosition_world = WorldRayOrigin() + (currentRayDirection_world * RayTCurrent());
		newRayDescription.Origin = currentIntersectionPosition_world;
	}
	{
		const cAffineTransform transform_localToWorld = ObjectToWorld4x3();
		const float3 normal_triangle_world = TransformDirection(normal_triangle_local, transform_localToWorld);
		const float3 reflectedDirection_world = reflect(currentRayDirection_world, normal_triangle_world);
		newRayDescription.Direction = normalize(reflectedDirection_world);
	}
	...
}
const RaytracingAccelerationStructure rayTraceAcceleration = ResourceDescriptorHeap[
	g_constantBuffer_perFrame.index_rayTraceAccelerationOffset
		+ g_constantBuffer_perDispatch.rayTraceAccelerationId];
...
sRayTracePayload newPayload;
{
	newPayload.recursionDepth = currentRecursionDepth + 1;
}
TraceRay(rayTraceAcceleration, ..., newRayDescription, newPayload);
color_material *= newPayload.color;
A new ray is calculated, using the intersection as its origin and in this simple case a perfect reflection for its new direction, and then the TraceRay() function is called and the result used. Again, this is exactly how I would expect ray tracing to be and it was fun to write these ray tracing shaders and feel like I was putting on an old comfortable glove. (Also again, it feels like living in the future that the GPU can look up arbitrary data and then trace arbitrary rays… amazing!)
The Bad News
Unlike the HLSL shader code, however, the C++ application code was not so straightforward. I should say up front that I am not trying to imply that I think the API has anything wrong with it or is poorly designed or anything like that: The way that it is all makes sense, and there wasn’t anything where I thought something was bad and should be changed. Rather, it’s just that it felt very complex and hard to learn how it all worked (and even now when I have it running and have wrapped it all in my own code I find that it is difficult for me to keep all of the different parts in my head).
I think part of the problem for me personally is that it’s not just DirectX ray tracing (“DXR”) that is new to me, but also DirectX 12 (all of my professional experience is with DX11 and the previous console generation which was DX9-ish). I think that it’s pretty clear that learning DXR would have been much easier if I had already been familiar with DX12, and that a large part of what feels like so much complexity is just the inherent complexity of working with low-level GPU stuff, which is new to me.
Still, it seems safe to assume that many people wanting to learn GPU ray tracing would run into the same difficulties. One of the nice things about ray tracing that I mentioned earlier in this post is how simple it is, but diving into it on the GPU at the pure low level that I did is clearly not a good approach for anyone who isn’t already familiar with graphics. One thing that really frustrated me trying to learn it was that the samples and tutorials from both Microsoft and Nvidia that purported to be “hello world”-type programs still used lots of helper code or frameworks and so it was really hard to just see what functions had to be called (one big exception to this was this awesome tutorial which was exactly what I wanted and much more helpful to me for what I was trying to do than the official Microsoft and Nvidia sample code). I think I can understand why this is, though: If someone isn’t trying to write their own engine explicitly from scratch but instead just wants to trace rays then writing shaders is probably a better use of time than struggling to learn the C++ API side.
What’s Next?
Although mirror reflections are cool-ish, the real magic that ray tracing makes possible is when the reflections are spread out. I don’t have any experience with denoising and so it’s hard for me to even predict what will be possible in real time given the limited number of rays that can be traced each frame, but my dream would be to use ray tracing for nice shadows. Hopefully there will be cooler ray tracing images to show in the future!
Problems Building Shaders
I have been working with my own custom build system, and it has been working really well for me while building C++ code. As I have been adding the capability to build shaders, however, I have run into several problems, some of which I don’t have good solutions for. Most of them are curiously interrelated, but the biggest single problem could be summarized as:
The
#includefile dependencies aren’t known until a shader is compiled, and there isn’t a great mechanism for getting that information back to the build system
This post will discuss some of the individual problems and potential solutions.
How Dependencies are Handled Generally
I have a scheme for creating files with information about the last successful execution of a task. There is nothing clever or special about this, but here is a simple example:
{
	"version":1,
	"hash":"2ade222a1aff526d0d4df0a2f5849210",
	"paths":[
		{"path":"Engine\\Type\\Arithmetic.test.cpp","time":133783428404663533},
		{"path":"temp\\win64\\unoptimized\\intermediate\\jpmake\\Precompiled\\Precompiled_common.c843349982ad311df55b7da4372daa2d.pch","time":133804112386989788},
		{"path":"C:\\Program Files\\Microsoft Visual Studio\\2022\\Community\\VC\\Tools\\MSVC\\14.41.34120\\bin\\Hostx64\\x64\\cl.exe","time":133755106284710903},
		{"path":"jpmake\\IDE\\VS2022\\temp\\x64\\Release\\output\\jpmake\\jpmake.exe","time":133804111340658384}
	]
}
This allows me to record 1) which files a specific target depends on, 2) what the last-modified times of each file was the last time that the task with the target as an output was executed, and 3) a hash value that contains any other information that should cause the task to be executed again if something changes.
This has worked well for all of the different kinds of tasks that I have added so far and it usually corresponds pretty closely what the user has manually specified. The one big exception has been C++ compilation in which case things are more complicated because of #include directives. Rather than require the user to specify individual files that are #included (and then transitive files that those files #include) the build system instead uses a command argument to have MSVC’s compiler create a file with the dependencies and then that file’s contents are added to the dependency file that my build system uses.
This is possible because I have made building C++ a specialized kind of task where I have implemented everything; this means that the Lua interface that the user (me) worries about is designed to be easy-to-use and then the build system takes care of all of the annoying details.
What about Shaders?
My mental goal has been to design the build system generally so that any kind of task can be defined, and that Lua is used for the project files so that any kind of programming can be done to define these tasks. I always knew that I would make some kind of specialized tasks that could be considered common (copying files is the best example of this), but the aspirational design goal would be to not require specialized tasks for everything but instead let the user define them.
The main motivation behind this design goal was so that “assets” could be handled the same way as code. I wanted to be able to build asset-building programs and then use them to build assets for a game, and I didn’t want to have to create specialized task types for each of these as part of the build system (the build system should be able to be used with any project, with no knowledge about my specific game engine).
Building shaders as the first kind of asset type has revealed a problem that is obvious but that I somehow didn’t fully anticipate: How to deal with implicit dependencies, specifically #include directives, when the task type is just an arbitrary command with arguments that the build system has no specialized knowledge of?
Dependency Callback
Like its C++ cl.exe compiler, Microsoft’s dxc.exe shader compiler can output a file with dependencies (e.g. the #include files). My current scheme is to allow the user to specify a callback that is called after a command execution succeeds and which returns any dependencies that can’t be known until after execution; this means that the callback function can parse and extract the data from the dependencies file that dxc.exe outputs and then report that data back to the build system. Here is currently how that can be done for a single shader:
local task_engineShaders = CreateNamedTask("EngineShaders")
local path_input = ResolvePath("$(engineDataDir)shaders.hlsl")
do
	local dxc_directory = g_dxc_directory
	local path_output_noExtension = ResolvePath("$(intermediateDir_engineData)shader_vs.")
	local path_output = path_output_noExtension .. "shd"
	local path_dependenciesFile = path_output_noExtension .. "dep.dxc"
	task_engineShaders:ExecuteCommand{
			command = (dxc_directory .. "dxc.exe"), dependencies = {(dxc_directory .. "dxcompiler.dll"), (dxc_directory .. "dxil.dll")},
			inputs = {path_input},
			outputs = {path_dependenciesFile},
			arguments = {path_input,
					"-T", "vs_6_0", "-E", "main_vs", "-fdiagnostics-format=msvc",
					"-MF", path_dependenciesFile
				},
			postExecuteReturnDependenciesCallback = ReturnShaderDependencies, postExecuteReturnDependenciesCallbackUserData = path_dependenciesFile
		}
	local path_debugSymbols = path_output_noExtension .. "pdb"
	local path_assembly = path_output_noExtension .. "shda"
	task_engineShaders:ExecuteCommand{
			command = (dxc_directory .. "dxc.exe"), dependencies = {(dxc_directory .. "dxcompiler.dll"), (dxc_directory .. "dxil.dll"), path_dependenciesFile},
			inputs = {path_input},
			outputs = {path_output},
			arguments = {path_input,
					"-T", "vs_6_0", "-E", "main_vs", "-fdiagnostics-format=msvc",
					"-Fo", path_output, "-Zi", "-Fd", path_debugSymbols, "-Fc", path_assembly,
				},
			artifacts = {path_debugSymbols},
			postExecuteReturnDependenciesCallback = ReturnShaderDependencies, postExecuteReturnDependenciesCallbackUserData = path_dependenciesFile
		}
end
The first problem that is immediately noticeable to me is that this is a terrible amount of text to just build a single shader. We will return to this problem later in this post, but note that since this is Lua I could make any convenience functions I want so that the user doesn’t have to manually type all of this for every shader. For the sake of understanding, though, the code above shows what is actually required.
The source path is specified on line 2, the compiled output path on line 6, and then the dependencies file path that DXC can output on line 7. Two different commands are submitted for potential execution, on lines 8 and 20, and then line 29 shows how the callback is specified (there is a function and also some “user data”, a payload that is passed as a function argument).
Why are there two different commands? Because DXC requires a separate invocation in order to generate the dependency file using -MF. I found this GitHub issue where this is the behavior that was specifically requested (although someone else later in the issue comments writes that they would prefer a single invocation, but I guess that didn’t happen). This behavior is annoying for me because it requires two separate sub tasks, and it is kind of tricky to figure out the dependencies between them.
Here is what the callback function looks like:
do
	local pattern_singleInput = ":(.-[^\\]\r?\n)"
	local pattern_singleDependency = "%s*(.-)%s*\\?\r?\n"
	local FindAllMatches = string.gmatch
	--
	ReturnShaderDependencies = function(i_path_dependenciesFile)
		local o_dependencies = {}
		-- Read the dependencies file
		local contents_dependenciesFile = ReadFile(i_path_dependenciesFile)
		-- Iterate through the dependencies of each input
		for dependencies_singleInput in FindAllMatches(contents_dependenciesFile, pattern_singleInput) do
			-- Iterate through each dependency of a single input
			for dependency in FindAllMatches(dependencies_singleInput, pattern_singleDependency) do
				o_dependencies[#o_dependencies + 1] = dependency
			end
		end
		return o_dependencies
	end
end
First, the good news: It was pretty easy to write code to parse the dependencies file and extract the desired information, which is exactly what I was hoping for by using Lua.
Unfortunately, there is more bad news than good.
The reason that there is a separate callback and then user data (rather than using the dependencies file path as an upvalue) is so that there can be just a single function, saving memory. I also discovered a way to detect if the function had changed using the lua_dump() function, and this seemed to work well initially. I found, however, that lua_dump() doesn’t capture upvalues (which makes sense after reading about it, because upvalues can change), which means that there is a bug in the callback I show above: If I change the patterns on line 2 or line 3 it won’t trigger the task to execute again because I don’t have a way of detecting that a change happened. In this specific case this is easy to fix by making the strings local to the function (and, in fact that’s probably better anyway regardless of the problem I’m currently discussing), but it is really discouraging to realize that there is this inherent problem; I don’t want to have to remember any special rules about what can or can’t be done, and even worse I don’t want dependencies to silently not work as expected if those arcane rules aren’t followed.
There is another fundamental problem with using a Lua function as a callback: It means that there must be some kind of synchronization between threads. The build system works as follows:
- Phase 1: Gather all of the info (reading the Lua project file and storing all of the information needed to determine whether tasks need to be executed and to execute them)
- During this phase all data is mutable, and everything is thus single-threaded
- Phase 2: Iterate through each task, deciding whether it must be executed and executing it if necessary
- During this phase all data is supposed to be immutable, and everything can thus be multi-threaded
- (As of this post everything is still single-threaded because I haven’t implemented different threads yet, but I have designed everything to be thread safe looking towards the future when tasks can be executed on different threads simultaneously)
The problem with using Lua during Phase 2 is that it violates these important design decisions. If Phase 2 were multi-threaded like it is intended to be then there would be a bad bug if two different threads called a Lua function at the same time. I don’t think that the problem is insurmountable: There is a lua_newthread() function that can be used to have a separate execution stack, but even with that there are some issues (e.g. if I assume that all data is immutable then I could probably get away without doing any locking/unlocking in Lua, but I don’t have any way of enforcing that if I allow arbitrary functions to be used as callbacks (a user could do anything they wanted, including having some kind of persistent state that gets updated every time a Lua function is called), which again involves arcane rules that aren’t enforceable but could cause bad bugs).
What I really want is to allow the user to use as much Lua as they want for defining tasks and dependencies in Phase 1, but to never use it again once Phase 2 starts. But, even though that’s the obvious ideal situation, how is it possible to deal with situations where dependencies aren’t known until execution and they must be reported?
Possible Solutions
Unfortunately, I don’t have good solutions yet for some of these problems. I do have a few ideas, however.
Automatic Dependencies
My dream change that would help with a lot of these problems would be to have my build system detect which files are read when executing a task so that it can automatically calculate the dependencies.
Look again at one of the lines where I am defining the shader compilation task:
command = (dxc_directory .. "dxc.exe"), dependencies = {(dxc_directory .. "dxcompiler.dll"), (dxc_directory .. "dxil.dll")},The user specifies dxc.exe, which is good because that’s the program that must run. But then it’s frustrating that dxcompiler.dll and dxil.dll also have to be specified; I only happen to know that they are required because they come bundled with dxc.exe, but how would I know that otherwise? There are certainly other Windows DLLs that are being used by these three that I don’t have listed here, and why should I have to know that? Even if I took the time to figure it out a single time is it also my responsibility to track this every time that there is a DXC update?
There is a build system named tup that takes care of figuring this out automatically, but although I have looked into this several times it doesn’t seem like there is an obvious way to do this (at least in Windows). I think the general method that would be required is 1) create a new process but with its main thread suspended, 2) hook any functions in that process that are relevant, 3) resume the main thread. The hooking step, though, seems tricky. It also seems difficult to differentiate between file accesses that should be treated as dependencies and ones that are outputs; I think maybe if there is any kind of write permission then it could be treated as not-a-dependency, but I haven’t fully thought that through.
I have looked into this automatic dependency calculation several times and every time given up because it looks like too big of a task. If I were working full time on the build system I think this is what I would do, but since my main goal currently is the game engine it has been too hard for me to justify trying to make this work. Having said that, it seems like the only way to handle these problems that would satisfy me as a user, and so maybe some day I will dive in and try to make it work.
Two Invocations of DXC.exe
Without automatic dependency calculation then it seems required to have two different invocations of dxc.exe. The solution to this from the standpoint of a nice build project file seems, at least, pretty obvious: Write a custom tool with my own command arguments which could internally execute dxc.exe twice, but that would only be run once from the perspective of the build system. Having a wrapper tool like this would also mean that I could create my own command arguments, with a related benefit that the same program and same arguments could be called for any platform (and the wrapper tool could then do the appropriate thing).
Avoiding Lua Callbacks
One idea I have had is that an execute-command task could be required to create its own dependency file. If I am already going to write some kind of shader compiler wrapper program around dxc.exe then I could also have it load and parse the dependency file and output a different dependency file in the format that my build system wants. This has some clear disadvantages because it means a user is expected to write similar wrapper tools around any kind of command that they want to execute, which is obviously a huge burden compared to just writing a Lua function. I think the advantage is that it would avoid all of the potential problems with violating confusing rules about what can or can’t be done in a Lua function in my build system, and that is attractive to avoid silent undetectable bugs, but it certainly doesn’t fit in with the ergonomics that I imagined.
I need to think about this more and hope that I come up with better ideas.
Specialized Shader Tasks
A final solution would be for me to just make a specialized task type for building shaders, just like I have for C++. Then I could write it all in C++ code, try to make it as efficient as possible, and it would accomplish the same end goal of letting me specify configuration and making it cross platform just like a separate “wrapper” program would do, but it would be part of the build system itself (rather than requiring any user of the build system to do the same thing). This avoids the fundamental problems with arbitrary commands but those problems will eventually have to be solved for other asset types; I think it might be worth doing, however, because shaders are such an important kind of asset.
The big reason I hesitate to do this (besides the time that it would take to do) is that there is a lot of custom code that can be built up around shaders. My engine is still incredibly basic and so I have just focused on compiling a hand-written shader source file, but eventually (if I have time) the shader source files will be generated somehow, and there could well be a very involved process for this and for getting reflection data and for generating accompanying C++ code. Knowing this and thinking about past systems that I have built at different jobs I am not sure if it makes sense to spend time making a system focused on dxc.exe that I might not end up using; maybe I will end up with a “wrapper” program anyway that does much more than just compiling shaders.
Update: Improving User API with Lua
I alluded to this in the original post but didn’t give an example. Since Lua is used to define how things get built it is possible to hide many of the unpleasant boilerplate details of a task (e.g. a task to build shaders) behind nice abstractions. The following is an example of something that I came up with:
local task_engineShaders = CreateNamedTask("EngineShaders")
local path_input = "$(engineDataDir)shaders.hlsl"
local path_output_vs, path_output_ps
do
	local entryPoint = "main_vs"
	local shaderType = "vertex"
	local path_intermediate_noExtension = "$(intermediateDir_engineData)shader_vs."
	path_output_vs = path_intermediate_noExtension .. "shd"
	BuildShader(path_input, entryPoint, shaderType, path_output_vs, path_intermediate_noExtension, task_engineShaders)
end
do
	local entryPoint = "main_ps"
	local shaderType = "pixel"
	local path_intermediate_noExtension = "$(intermediateDir_engineData)shader_ps."
	path_output_ps = path_intermediate_noExtension .. "shd"
	BuildShader(path_input, entryPoint, shaderType, path_output_ps, path_intermediate_noExtension, task_engineShaders)
end
This code builds two shaders now (a vertex and a pixel/fragment shader), compared to the single shader shown previously in this post, but it is still much easier to read because most of the unpleasantness is hidden in the BuildShader() function. This function isn’t anything special in the build system but is just a Lua function that I defined in the project file itself. This shows the promise of why I wanted to do it this way, because it makes it very easy to build abstractions with a fully-powered programming language.
How does a Waitable Swap Chain Work?
DXGI 1.3 introduced the concept of a waitable swap chain, which allows a program to block waiting for a vblank before a frame starts getting generated rather than having to block waiting for a vblank after a frame is finished being generated. The basic concept is easy to understand but I had a lot of questions about the details of how it worked that were not at all obvious to me from any documentation that I could find.
Disclaimer: This post is not written from a place of confident knowledge. Instead, I am documenting my current understanding based on some frustrating trial and error but it is quite possible that I have some details wrong. I am writing this in case it helps others to save time (I am surprised that I haven’t found others asking similar questions, although maybe I just haven’t been using the correct search terms), but caveat emptor.
Some official documentation on waitable swap chains:
- https://learn.microsoft.com/en-us/windows/uwp/gaming/reduce-latency-with-dxgi-1-3-swap-chains
- https://learn.microsoft.com/en-us/windows/win32/api/dxgi1_3/nf-dxgi1_3-idxgiswapchain2-getframelatencywaitableobject
Summary
The following is a list of things that I think I have discovered but that were not obvious to me:
- The waitable object must be (successfully) waited on for every call to Present(), but it is initialized with some additional inherent waits equal to the value provided to
IDXGISwapChain2::SetMaximumFrameLatency()- I believe that any outstanding required waits are canceled by
DXGI_PRESENT_RESTARTtoPresent()(meaning that it is ok to not wait on the waitable object before callingPresent()with that flag, and after a successful call toPresent()with that flag there is only a single time that the waitable object must be waited for regardless of the state of the waitable object before that call)
- I believe that any outstanding required waits are canceled by
- The waitable object behaves like a FIFO (first-in-first-out) queue, and so waiting for it to signal is waiting for the oldest queued
Present()call to actually be executed - The waitable object behaves like a Windows event, meaning that there is not a chance of missing the vblank signal if application code doesn’t wait soon enough. If an attempt to wait is made before the vblank then the wait will block, but an attempt can be made any time after the vblank (which should hopefully return immediately), and successfully waiting on the waitable object is what clears/resets a particular queued
Present()call. - When a swap chain is created with a waitable object,
Present()not only doesn’t block (which the documentation makes clear) but also doesn’t fail if the present queue is exceeded (and, specifically, doesn’t returnDXGI_ERROR_WAS_STILL_DRAWINGeven ifDXGI_PRESENT_DO_NOT_WAITis specified as a flag).
That last point made things especially difficult for me: The application is solely responsible for tracking the state of the present queue and this is generally fine since the waitable swap chain gives you the tools to do that, but the problem is that the documentation doesn’t mention the details that I list above. It is hard to know how to track the state of the present queue without knowing the behavior that one is tracking 🐔🥚.
Open questions that I don’t yet know the answers to:
- What happens if too many
Present()calls are made and the present queue is exceeded?- (I do know that you still have to successfully wait for the waitable object to signal for every
Present()call that returns success. I don’t know, however, what actually gets presented and when.)
- (I do know that you still have to successfully wait for the waitable object to signal for every
- What happens when 0 is provided as the sync interval to
Present()?- This, at least, is clearly discoverable. I just haven’t put in the time to do tests.
- What happens when a value greater than 1 is provided as the sync interval to
Present()?- I know how I would expect this to work, but I haven’t put in the time to verify this. With some very cursory tests things seemed to mostly behave as I would expect, but it wasn’t entirely clear and more testing on my part would be required to verify.
Below I will go into a few more details.
Paired Present() and Waits
This behavior is actually described on an Intel webpage: https://www.intel.com/content/www/us/en/developer/articles/code-sample/sample-application-for-direct3d-12-flip-model-swap-chains.html
Conceptually, the waitable object can be thought of as a semaphore which is initialized to the Maximum Frame Latency, and signaled whenever a present is removed from the Present Queue.
Embarrassingly, I had read that sentence several times as the entire page has valuable information but it unfortunately didn’t sink in. It was only in retrospect after I had figured it out for myself that I understood what it was saying.
The way that I ended up stumbling on the answer myself is to test how many times the waitable object can be waited on before it blocks and doesn’t return. Although I haven’t discovered any way of doing the opposite (i.e. detecting when the present queue is full) waiting for a wait to block at least gives a pretty clear way of testing how many Present() calls are “queued” from the perspective of the waitable object.
I don’t understand why it gets initialized to the SetMaximumFrameLatency() value, however. It’s not really clear to me what specific vblanks are actually being waited on in this case (are they specific vblanks that get queued somehow, or is there special code that detects that they are dummy pre-queued frames and just waits for the next one?). Also, in my code at least I end up wanting to do my own initial Present() and wait to initialize some timing (which I need to do with my own calls because that’s how the DXGI frame statistics work), and so these pre-queued things just get in the way. It seems like the decision to do this was probably made because otherwise the obvious pattern of waiting before the first frame would have blocked forever, but I guess I would have preferred this to be more explicitly documented (rather than just urging programmers to remember to wait before the first frame without explaining why).
I also ran into problems trying to figure out how to discard a queued present using DXGI_PRESENT_RESTART. I had a desire to do this when I detected that the call to Present() didn’t return until after a vblank, and so I knew that it missed the deadline and was going to take a future frame’s spot. It was surprisingly tricky for me to figure out how to actually make this work, though, since the waitable object has some implicit behavior. It kind of seems to me that DXGI_PRESENT_RESTART does not reset the waitable object’s internal count of waits (meaning that you can still wait for the number of successful Present() calls before it blocks indefinitely), which was frustrating because I didn’t know how to clear this out (the only way to clear it is to successfully wait, but successfully waiting meant I was delayed until the next vblank which is exactly what I was trying to avoid). Eventually, though, I just pretended that it was cleared and then everything seemed to work (meaning that the successful returns from waits happen when I would want them to). It’s not clear to me what is actually happening, and whether me pretending the problem doesn’t exist will eventually come back to bite me.
Frame Pacing with Simulation and Input
This post expands on ideas that were introduced in the Frame Pacing in a Very Simple Scene post, and that earlier post should probably be read and understood before this one in order to have context into what the profiler screenshots mean.
To skip to the images find the Visualizing in a Profiler section.
To skip to the sample programs find the Example Programs section or download them here.
In the previous post I had used the Tracy profiler to help visualize what my rendering code was doing; specifically I was interested in scheduling when CPU code would generate commands for the GPU to execute to make sure that it was happening when I wanted it to. I raised the question of why not generate GPU commands even earlier to make sure that they were ready in time and discussed why doing so would work with predetermined content (like video, for example), but would be less ideal for an interactive experience (like a game) because it would increase latency between the user providing input and the results of that input being visible on the display.
This post will show the work I have done to implement some user input that can influence the game simulation, and how that interacts with rendering frames for the display.
How to Coordinate Display Frames with Simulation Updates
A traditional display changes the image that it displays at a fixed rate, called the “refresh rate”. As an example, the most common refresh rate is 60 Hz, where “Hz” is the symbol for Hertz, a unit of frequency, which means that a display with a fixed refresh rate of 60 Hz is changing the image that it displays 60 times every second. This means that a program has to generate a new image and have it ready for the display 60 times every second. There is a fixed deadline enabled by something called vsync, and this puts a constraint on how often to render an image and when. (For additional details about dealing with vsync and timing, see the post Syncing without Vsync. For additional details about how to schedule the generation of display frames for vsync see the post that I have already referred to, Frame Pacing in a Very Simple Scene.)
Just because the display is updating at some fixed rate, however, doesn’t mean that the rest of the game needs to update at that same fixed rate, and it also doesn’t mean that the rest of the game should update at that same fixed rate. There is a very well-known blog post that discusses some of the reasons why, Fix Your Timestep!, which is worth reading if you haven’t already. In my own mental model the way that I think about this is that I want to have an interactive experience that is, conceptually, completely decoupled from the view that I generate in order to let the user see what is going on. The game should be able, conceptually, to run on its own with no window, and the player could also pick up a controller and influence that game, and whatever happens should happen the same way regardless of what it would look like to the player if there were a window (and regardless of what refresh rate, resolution, or anything else the player’s display happens to have).
My challenge since the last post, then, has been to figure out how to actually implement this mental model.
Display Loop
I am trying to design my engine to be platform-independent but the only actual platform that I am programming for currently is Windows; this means that behind all of the platform-independent interfaces there is only a single platform-specific implementation and it is for Windows. On Windows there is a very tight coupling between a window and a D3D12 swap chain, and there is also a very tight coupling between any window and the specific thread where it was created. Because of this, my current design is to have what I am calling the “display thread”, and this thread is special because it handles the main window event queue (meaning the events that come from the Windows operating system itself). This is also the thread where I submit the GPU render commands and requests to swap (for the swap chain) and that means that there is a built-in cadence in this thread that matches the fixed refresh rate.
What I needed to figure out was how to allow there to be a separate fixed update rate for the game simulation, which could either be faster or slower than the display refresh rate, and how to coordinate between the two. The strategy that was initially obvious to me was to have a separate thread that handled the simulation updates and then to have the display thread be able to coordinate with this simulation thread. I think that this would work fine (many games have a “game thread” and a “render thread”), but there is an aspect of this design that made me hesitate to implement it this way.
My impression is that over the past several years games have been moving away from having fixed threads with specific responsibilities and instead evolving to be more flexible where “jobs” or “tasks” can be submitted to any available hardware threads. The benefit of this approach is that it scales much better to any arbitrary number of threads. I have read about engines that don’t have a specific “game thread” or “render thread”, and the idea is appealing to me on a conceptual level. Although I don’t have any job system in place yet I feel like this is the direction that I at least want to aspire to, and that meant that I had to avoid my initial idea of having a separate simulation thread with its own update cadence.
Instead, I needed to come up with a design that would allow something like the following:
- It can be calculated which display frame needs to be rendered next, and what the time deadline is for that to be done
- Based on that, it can be calculated which simulation updates must happen in order to generate that display frame
- Based on that, some threads can update the simulation accordingly
- Once that is done some threads can start to generate the display frame
This general idea gave me a way to approach implementing simulation updates at some fixed rate that coordinated with display updates at some other fixed rate, even though I only have a single thread right now and no job system. Or, said another way, if I could have different multiple simultaneous (but arbitrary and changeable) update cadences in a single thread then it might provide a natural way forward in the future to allow related tasks to run on different threads without having to assign specific fixed responsibilities to specific fixed threads.
Interpolation or Extrapolation?
There is something tricky that I don’t address in the simplified heuristic above: How can it be known which simulation updates must be done before a display frame can be generated? At a high level there are three options:
- Make the simulation and display tightly coupled. I already discussed why this is not what I want to do.
- Simulate as much as possible and then generate a display frame that guesses what will happen in the future. This involves taking known data and extrapolating what will happen next.
- Simulate as much as possible and then generate a display frame of what has already happened in the past. This involves taking known data and interpolating what has already happened.
For months I have been fascinated with #2, predicting what will happen in the future and then extrapolating the rendering accordingly. I am not personally into fighting games but somewhere I heard or read about “rollback netcode” and then started reading and watching as much as I could about it. Even though I have no intention of making a network multiplayer game I couldn’t shake the thought that the same technique could be used in a single-player game to virtually eliminate latency. I ultimately decided, however (and unfortunately), that this wasn’t the way to go because I wasn’t confident in my ability to deal with mispredictions in a way that wouldn’t be distracting visually. My personal priorities are for things to look good visually and less about reducing latency or twitch gaming, which means that if there is a tradeoff to be made it will usually be to increase visual quality. (With that being said, if you are interested I think that my single favorite source that I have found about these ideas is https://www.youtube.com/watch?v=W3aieHjyNvw. Maybe at some point in the future I will have enough experience to try tackling this problem again.)
That leaves strategy #3, interpolation. This means that in order to start generating a frame to display I can only work with simulation updates that have already happened in the past, and that I need to figure out when these required simulation updates have actually happened so that I can then know when it is ok to start generating a display frame.
Below is a capture I made showing visually what I mean by interpolation:

The two squares are updating at exactly the same time (once each second), and they have identical horizontal positions from the perspective of the simulation. The top square, however, is rendering with interpolation such that every frame that is generated for display places the square where the simulation would have been at some intermediate point between discrete updates. This gives the illusion of smooth motion despite the simulation only updating once each second (the GIF makes the motion look less smooth, but you can download and try one of the sample programs to see how it looks when interpolating at your display’s actual refresh rate).
Notice in the GIF how this interpolation scheme actually increases latency: The bottom square shows the up-to-date simulation, and the top square (what the user actually sees) is showing some blended state between the most up-to-date position and then the previous, even older, position. The only time that the user sees the current state of the simulation is at the moment when the simulation is the most out-of-date, immediately before it is about to be updated again. For a slow update rate like in the GIF this delay is very noticeable, but on the opposite extreme if the simulation is updating faster than the display rate then this is less of a problem. You can download and try the sample programs to find out how sensitive you are to this latency and how much of a difference you can personally notice between different simulation update rates.
The (Current) Solution
I have come up with two variables that determine the behavior of a simulation in my engine and how it gets displayed:
- The (fixed) duration of a simulation update, in milliseconds
- The (fixed) cutoff time before a display refresh, in milliseconds, when a display frame will start to be generated
This was a surprisingly (embarrassingly!) difficult problem for me to solve especially given how simple the solution seems, and I won’t claim that it is the best solution or that I won’t change the strategy as time goes on and I get more experience with how it works. Let me elaborate on the second point, though, since that was the tricky part (the first point is obvious and so there is not much to discuss).
I knew that I wanted the simulation to run independently of the display. Said another way, the simulation shouldn’t even know or care that there are any frames being displayed, and the framerate of the display should never have any influence on the simulation. Note that this also extends to user input: The same input from a user should have the same effect on the simulation regardless of what framerate that user’s display has.
On the other hand, it seemed like it was necessary to have the display frames have some kind of dependency on the simulation: In order to interpolate between two simulation frames there has to be some kind of offset involved where the graphics system knows how far between two frames it is. My brain kept thinking that maybe the offset needed to be determined by how long the display’s refresh period is, but I didn’t like that because it seemed to go against my goal of different players having the same experience regardless of refresh rate.
Finally I realized that it could be a (mostly) arbitrary offset from the vertical blank. What this represents conceptually is a tradeoff between latency (a smaller time is better) and computational requirements (it must be long enough that the CPU and GPU can actually generate a display frame before the vblank happens). Having it be a fixed offset, however, means that it will behave mostly the same regardless of what the display is doing. (There is still going to be some system-dependent latency: If DWM is compositing then there is an inherent extra frame of latency, and then there is some unpredictable time from when the GPU scans the frame out until it is actually visible on the display which is dependent on the user’s actual display hardware and how it is configured. What this current solution seems to do, however, is to minimize the effects of display refresh rate in the software domain that I have control over.)
Visualizing in a Profiler
In order to understand how the simulation is scheduled relative to rendering we can look at Tracy profile captures. This post won’t explain the basics of how to interpret these screenshots, but you can refer to this previously-mentioned earlier post for a more thorough explanation.
In all of the screenshots in this post my display refresh rate is set to 60 Hz which means that a generated image is displayed for 16.67 milliseconds (i.e. 1000 / 60 ms). I have set the time before the vblank to start rendering to be half of that, 8.33 ms. Note that this doesn’t mean that this time is in any way meaningful or that it is ideal! Instead, I have deliberately chosen this time to make it easier for you as a reader to envision what is happening; the cutoff for when input for simulation frames is no longer accepted is always going to be at the halfway point between display frames.
Remember: The cutoff for user input in these screenshots is arbitrarily chosen to be exactly halfway between display frames.
100 Hz Simulation
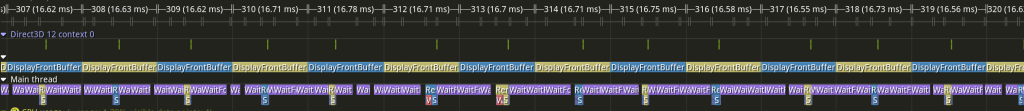
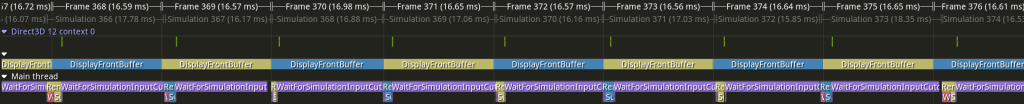
This first example has the simulation updating at 100 Hz, which means that each simulation update represents 10 ms (i.e. 1000 / 10):
As in the previous post, the DisplayFrontBuffer zones show when the display is changing, and it corresponds to the unnamed “Frames”, which each take 16.67 ms.
New in this post is a second kind of frame, which I’ve highlighted in green below:
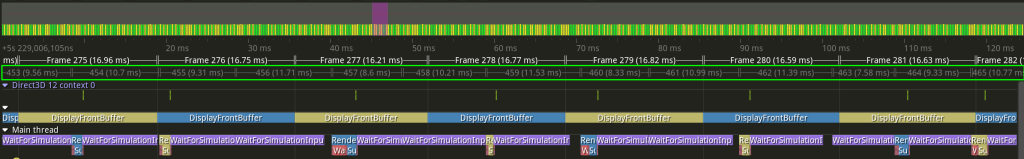
This shows where the simulation frames are happening, and each lasts roughly 10 ms. In the previous two screenshots I have the default display frames selected, but Tracy also allows the other frames to be selected in which case it will show those frames at the top:
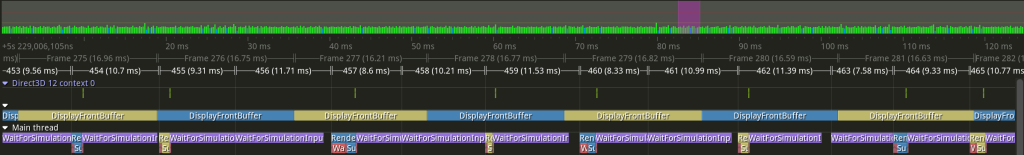
Each display frame takes 16.67 ms and each simulation frame takes 10 ms, and since these are not clean multiples the way that they line up is constantly varying. The following facts can help to understand and interpret these profile screenshots:
- The display frames shown are determined by a thread waiting for a vblank, and so this cadence tends to be quite regular and close to the ideal 16.67 ms
- The simulation frames shown are determined by whenever a call to Windows’s
Sleep()function returns, and more specifically whenever a call toSleep()returns that is after the required cutoff for input. This means that the durations shown are much more variable, and although helpful for visualization they don’t actually show the real simulation framesSleep()is notoriously imprecise; I have configured the resolution to be 1 ms, and newer versions of Windows have improved the call to behave more closely to how one might expect (see also here), but it is still probably not the best tool for what I am using it for.- For the purposes of this post you just need to keep in mind that the end of each simulation updates shown in the screenshots is conservative: It is always some time after the actual simulation update has ended, but how long after is imprecise and (very) inconsistent.
- The simulation frames shown don’t include any work done to actually update the simulation. Instead they represent the timeline of logical simulation updates; one way to think of them is the window of time when the user can enter input to influence the following simulation update (although this mental model may also be confusing because it hints at additional latency between the user’s input and that input being used; we will ignore that for this post and focus more the relationship between the simulation and the display but it will be something that I will have to revisit when I work on input).
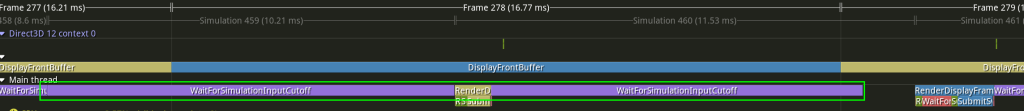
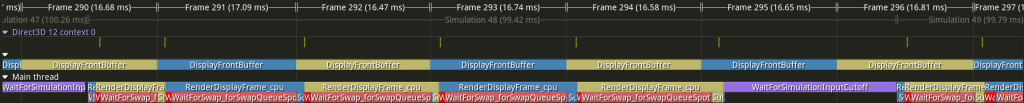
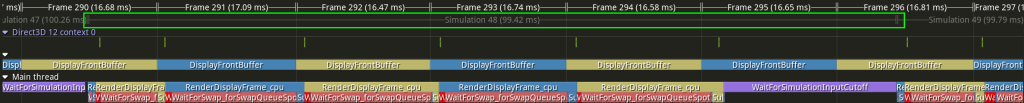
Let’s look at a single display frame, highlighted in green below:
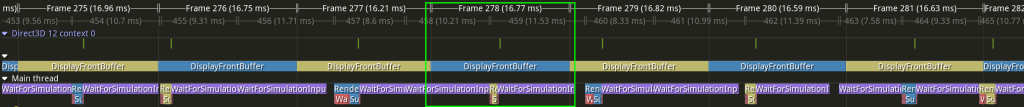
The blue swap chain texture is currently being displayed (i.e. it is the front buffer), and so the yellow swap chain texture must be written to in order to be displayed next (i.e. it is the back buffer). The purple WaitForSimulationInputCutoff zones show how the 10 ms simulation updates line up with the 16.67 ms display updates. The cutoff that I have specified is 8.83 ms before the vblank, and so the last WaitForSimulationInputCutoff that we can accept for rendering must finish before the halfway point of that blue DisplayFrontBuffer zone. In this example that I have chosen the simulation frame ends a little bit before the halfway point, and then the work to generate a new display frame happens immediately. Here is a zoomed in version of that single display frame to help understand what is happening:
After the purple WaitForSimulationInputCutoff is done the CPU work to record and submit GPU commands to generate a display frame happens. In the particular frame shown in the screenshot there is no need to wait for anything (the GPU finished the previous commands long ago, and the yellow back buffer is available to be changed because the blue front buffer is being shown which means that recording and submission of commands can happen immediately). The GPU also does the work immediately (the little green zone above the blue DisplayFrontBuffer), and everything is ready to be displayed for the next vblank, where the yellow texture can now be swapped to become the front buffer.
The situation in this screenshot is probably the easiest one to understand: The yellow rendering work is generating a display frame about 8.33 ms before it has to be displayed. That display frame will show an interpolation between two simulation frames, and the last of those two simulation frames ended where that yellow rendering work begins.
To try and make it more clear I’ve moved the timeline slightly earlier in the following screenshot so that we can see both simulation frames that are being used to generate the display frame, highlighted in green:
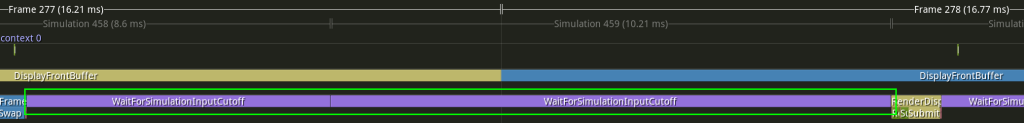
The yellow rendering work is now at the right of the screenshot (look at Frame 278 at the top to help orient yourself), and there are two purple WaitForSimulationInputCutoff zones highlighted. The yellow rendering work at the right of the screenshot is generating a display frame that contains an interpolation of some point in time between the first WaitForSimulationInputCutoff zone and the second WaitForSimulationInputCutoff zone.
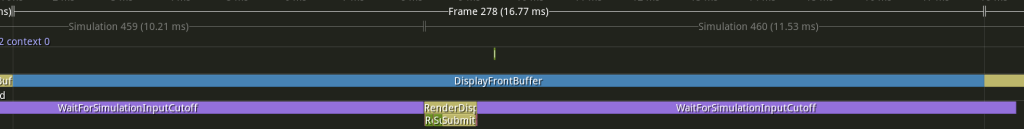
Let us now compare the next display frame, highlighted in green below:
Now the yellow texture is being displayed as the front buffer and the blue texture is the back buffer that must be modified. Because of the way that two different 16.67 ms and 10 ms cadences line up, however, the last simulation frame that can be used for this display frame ends relatively earlier, which means that rendering work can begin relatively earlier (note how the blue CPU work happens earlier in the display frame in the highlighted Frame 279 compared to where the yellow CPU work happened in the preceding Frame 278 that we looked at previously). The way that I think about this is to ask “when will the next simulation frame end?” In this case it would end after the 8.33 ms cutoff (at the midpoint of yellow Frame 279), and so it can’t be used for this display frame.
The two simulation frames that are being used to generate Frame 279 are shown below highlighted in green:
The ending simulation frame is new, but the beginning simulation frame is the same one that was used as the ending simulation frame for the previous display frame. These examples hopefully give an idea of how the display frames are being generated independently of the cadence of the simulation frames, and how they are showing some “view” into the simulation by interpolating between the two most recently finished simulation frames. The code uses the arbitrary cutoff before the vblank (8.33 ms in these screenshots) in order to decide 1) what the two most recently finished simulation frames are and 2) how much to interpolate between the beginning and ending simulation frames for a given display frame.
When interpolating, how can the program determine how far between the beginning simulation frame and the ending simulation frame the display frame should be? The amount to interpolate is based on how close the display frame cutoff is to the end of the simulation frames. This can be confusing for me to think about, but the key insight is that it is dependent on the simulation update rate. The way that I think about it is that I take the cutoff in question (which, remember, happens after the ending simulation frame) and then subtract the duration of a simulation update from that. Whatever that time is must fall between the beginning and ending simulation update, and thus determines the interpolation amount.
I’m not sure whether to spend more time explaining that or whether it’s obvious to most people and possibly just confusing to me for some reason. I think that what makes it tricky for me to wrap my head around is that the interpolation is between two things that have both happened in the past (whereas if I were instead doing extrapolation with one update in the past and one in the future then it would be much more natural for how my brain tries to think about it). Rather than belaboring the point I will repeat the GIF of the two moving squares, which I think is an easier way to understand visually how the interpolation is working:
Let’s look again at the two simulation frames that each display frame uses, one after the other:
It is hard to say anything very precise about the interpolation amount because of the imprecision of the purple WaitForSimulationInputCutoff zones (because of the inherent imprecision of the Sleep() function), but we can at least make some generalizations using some intuitive reasoning:
- The earlier that the ending simulation update happens relative to the display frame cutoff, the more the interpolation amount will be biased towards the ending simulation update
- The closer that the ending simulation update happens relative to the display frame cutoff, the more the interpolation amount will be biased towards the beginning simulation update
With that in mind, in the first screenshot we can say that the yellow display frame work (which will be shown in Frame 279) is going to show something closer to the beginning simulation update (the first one highlighted in green); we can claim this because the ending simulation update ended so close to the 8.33 ms cutoff (halfway between the blue DisplayFrontBuffer zone), and if we subtract the 10 ms simulation update duration it is going to be pretty close to end of the beginning simulation update.
In the second screenshot, by comparison, we can say that the blue display frame work (which will be shown in Frame 280) is going to show more of the ending simulation update (the second one highlighted in green); we can claim this because the ending simulation updated ended quite some time before the 8.33 ms cutoff.
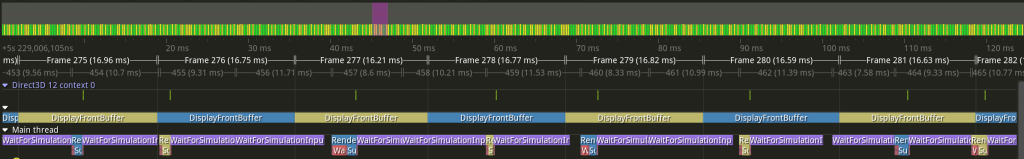
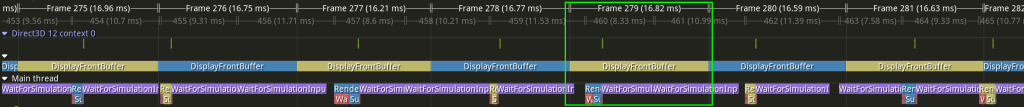
Before moving on to a different simulation update rate let’s look one more time at the original screenshot that shows many display and simulation frames:
This screenshot shows how the two different frame cadences line up at different points. It also shows how the rendering work starts being done as soon as it is possible, but that it isn’t possible until after the end of the last simulation update before the cutoff (again, remember that the cutoff is arbitrary but was chosen to be 8.33 ms so that it is easy to visualize as being at the halfway point of each display frame).
250 Hz
This next example has the simulation updating at 250 Hz, which means that each simulation update is 4 ms (i.e. 1000 / 250):
There are now more simulation updates for every display update (about 4, i.e. 16.67 ms / 4 ms), but otherwise this profile should look familiar if you were able to follow the previous discussion about 100 Hz. One interesting pattern is that the smaller the duration of simulation updates the more consistently closer to the halfway cutoff the display frame render work will be (you can imagine it as taking a limit as simulation updates get infinitesimally small, in which case the display frame render work would conceptually never be able to start early).
A high frequency of simulation updates like this would be the ideal way to run. The visual representation of the simulation would still be limited by the display’s refresh rate but the simulation itself would not be. Of course, the simulation is still constrained by how computationally expensive it is to update. In my example I’m just updating a single position using velocity and so it is no problem, but in a real game the logic and physics will take more time. You can download and try an example program to see how it feels to have the square’s position update at 250 Hz.
(I have also found that there are many more visual glitches/hitches running at this high frequency, meaning that display frames are skipped for various reasons. In my particular program this might be my fault, since the rendering work seems so simple (if I used a busy wait instead of Sleep(), for example, I might get better results), but it generally suggests that it probably isn’t possible to have such low latency with such a high refresh rate in a non-toy program. If I increase the cutoff time to give my code some buffer for unexpectedly long waits then things work much better, even at a high simulation update frequency.)
10 Hz
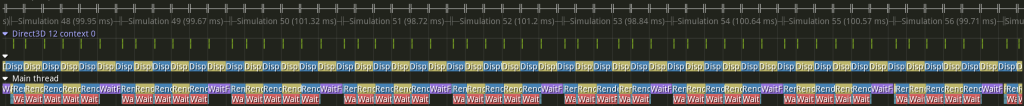
The next example has the simulation updating at 10 Hz, which means that each simulation update is 100 ms (i.e. 1000 / 10). Notably, this is a case of the opposite situation as the previous example: Rather than having many simulation updates for one display update this example has many display updates for one simulation update:
This example looks quite a bit different from the preceding two because the simulation update duration is so much longer than the display update duration. You can see that there are still purple WaitForSimulationInputCutoff zones, but they only occur when there is an actual need to wait, and that only happens when a simulation update is going to end during a display refresh period.
To make this more clear I have highlighted the actual simulation frame below in green:
Note that the simulation update itself is quite long, and the purple WaitForSimulationInputCutoff zone only happens at the end. If a display frame must be generated but the two required simulation updates that it is going to interpolate between have already happened then there is no need to wait for another one.
On the other hand, we do see new waits that are much more obvious than they were in the previous examples. These are the reddish waits, where the most obvious one is WaitForSwap_forSwapQueueSpot. I apologize for the awkward name (I have been trying different things, and I’m not in love with this one yet), but it is waiting for the currently-displayed front buffer to be swapped so that it no longer displayed and can be modified as a back buffer. Rendering happens so quickly that a very large percentage of the display frame is spent waiting until the back buffer texture is available, after which (when the DisplayFrontBuffer color switches) some CPU work and then GPU work is done very quickly, and the waiting starts again (for additional information see the previous post that I have already referenced, although it was just called “WaitForSwap” there). In a real renderer with real non-trivial work to be done there would be less waiting, but that is dependent on how long it takes to record GPU commands (before the vblank) and how long it takes to submit and execute those commands (after the vblank).
Although it is hard to see any details it is also instructive to zoom out more and see what it looks like over the course of several simulation updates:
There should be 6 display frames for every simulation update, and this can be seen in the screenshot.
This 10 Hz rate of simulation update is too slow to be satisfying; you can download a sample program and try it to see what it feels like, but it is pretty sluggish. Still, it is good news that this works because it is definitely possible that a program might update its display faster than its simulation and so trying an extreme case like this is a good test.
60 Hz
This next example has the simulation updating at 60 Hz, which means that each simulation update is 16.67 ms (i.e. 1000 / 60). More notably, it means that the simulation is updating at exactly the same rate as the display:
The display frame cutoff is still 8.33 ms, halfway between vblanks, but since the simulation and display update at the same time the simulation update ends close to a vblank and so the display frame work is able to happen early, right after a vblank.
(Since the simulation is happening on the CPU there is probably some small real-world difference between the CPU clock and the display refresh rate which has its own display hardware clock.. If I let this program run long enough there is probably some drift that could be observed and eventually the simulation updates would probably end closer to the cutoff (and then drift again, kind of going in and out of phase). Relatedly, I could probably intentionally make it not line up when the program starts if I put some work into it; the alignment is most likely an accidental result of how and when I am starting the simulation which is probably coincident with some display frame.)
30 Hz
This next example has the simulation updating at 30 Hz, which means that each simulation update is 33.33 ms (i.e. 1000 / 30), and also that the display updates twice for every single simulation update:
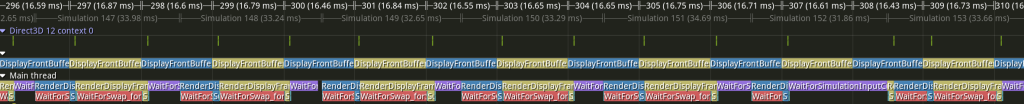
This shows what we would have expected: There are two display frames for every one simulation update, and that means that there is only a purple WaitForSimulationInputCutoff zone in the display frame where a simulation update is ending before the halfway 8.33 ms cutoff.
There is one part of the screenshot, however, that is interesting and perhaps surprising, during display Frame 307. I’ve highlighted it in green below:
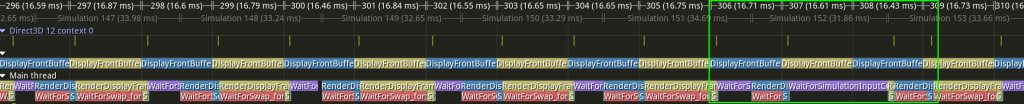
The previous pattern suddenly changes, and there is an unusually long WaitForSimulationInputCutoff zone. It kind of looks like there was a missed display frame (which can happen, although I haven’t shown it in this post; the program can fail to render a display frame in time and then needs to recover), but if we look at the pattern of alternating blue and yellow in the Main thread this isn’t actually the case.
The key to understanding what is happening is to look at the simulation frames rather than focusing on the display frames:
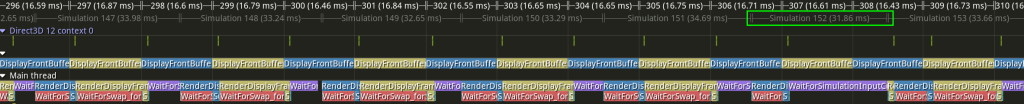
If you look at Simulation 152 and how it lines up with the work in the Main thread you may be able to figure out what is going on. This is an example of things (expectedly) going out of phase, and the code (correctly) dealing with it. If you compare Simulation 152 to the preceding Simulation 151 and subsequent Simulation 153 you can see that nothing unusual happened, and the simulation updates are happening approximately every 33.33 ms, as expected. What is unusual, however, is that Simulation 152 is ending right before the halfway cutoff for simulation updates, and so that yellow rendering work (for display frame 309) can’t start until Simulation 152 has finished. In the context of this screenshot it looks very scary because there is only 8.33 ms for the entire display frame to be generated, but this is the exact cutoff that I have chosen, meaning that I have told the program “don’t worry, I can do everything I need to in 8.33 ms and so use that as the cutoff for user input”. All of the other display frames in the screenshot have much more time (they have to wait for the front buffer to be swapped before they can even submit GPU commands), but this particular instance is doing exactly what I have told it to do, and is just a curious result of the different clocks of the CPU and display not being exact (which, again, is expected). (Notice that immediately after the yellow work with the tight deadline there is blue work, which puts the graphics system back on the more usual schedule where it is done ahead of time and can wait.)
Example Programs
I have made some example programs that have different simulation update rates but are otherwise identical. You can download them here.
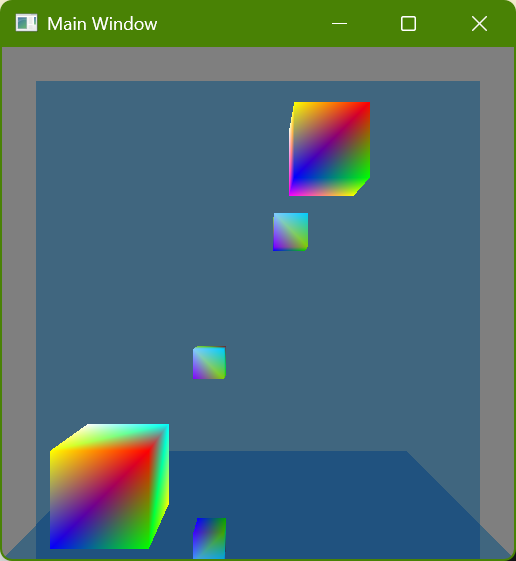
Running one of the sample EXEs will, if it doesn’t crash 🙃, show a window that looks like this:
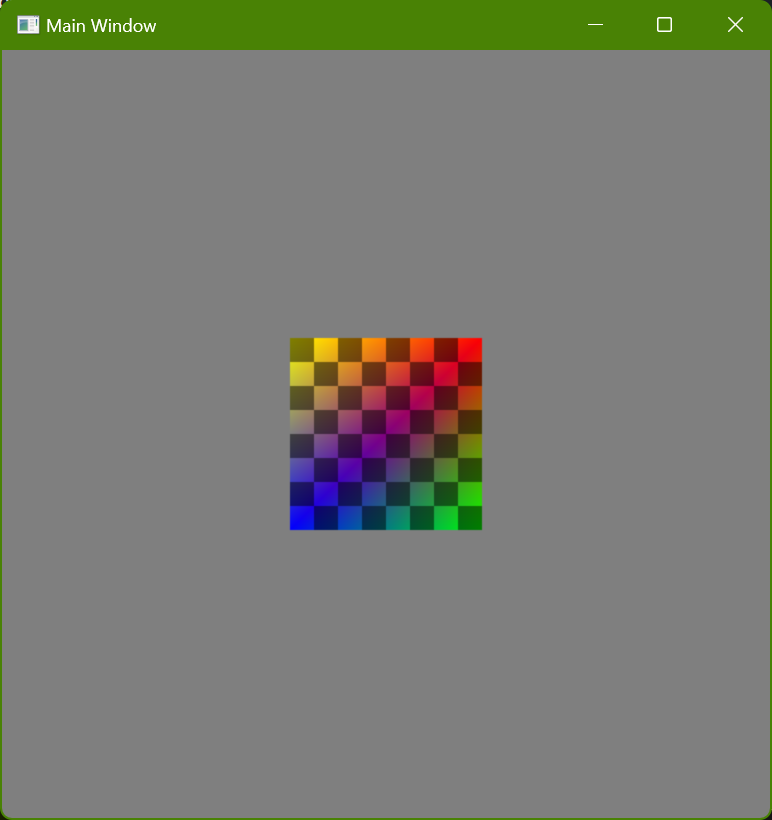
You can move the square using the arrow keys.
The square always moves in discrete steps, at whatever frequency the EXE filename indicates. Visually, however, the displayed frames use interpolation, as discussed in this post. (There are two alternate versions of the slowest update frequencies that don’t do any interpolation; these can be useful to run and compare with the versions that do use interpolation in order to better understand what is happening and why the slow frequencies feel kind of weird and sluggish, even though they look smooth.)
The cutoff before the vblank is set to 10 ms. This is slightly longer than all of the screenshots used in this post (that used 8.33 ms), but it is still small enough that glitches aren’t unusual at the higher simulation update frequencies. In a real program that is doing serious rendering work more time would probably be needed, but for the purposes of these demonstrations I wanted to try and minimize latency.
These programs can be fun to run and see how sensitive you personally are to latency. Try not to focus on any visual hitches (where e.g. a frame might be skipped), but instead try to concentrate on whether it feels like the square responds instantly to pressing a key or releasing it, or whether it seems like there is a delay. Some things to try:
- Really quick key presses. I generally use the same direction and then tap a rapid staccato pattern. This is what I personally am most sensitive to where the higher frequencies feel better.
- Holding down a key so the square moves with some constant velocity and then releasing it. I personally am not bothered as much by a delayed start (I know that some people are) as I am by a delayed stop (where the square keeps moving after I’ve let go of a key).
- At the lowest frequencies (5 Hz and 10 Hz) move the square close to the edge of the window and then try to tap quickly to move it in and out, meaning where a grey border is visible and when it isn’t. If you do this using the versions without interpolating it becomes pretty easy to intuitively understand how the square is moving in discrete steps (because there is a fixed velocity used with the fixed simulation timesteps), and then if you try the same thing with interpolation you can observe the same thing. Even though it looks smooth the actual behavior is tied to a grid, both spatially and temporally, and that’s a large part of why it feels weird (and why sometimes one key press might feel better or worse than another key press, depending on how much that key press aligns with the temporal “grid”).
Frame Pacing in a Very Simple Scene
I have recently integrated the Tracy profiler into my engine and it has been a great help to be able to visualize how the CPU and GPU are interacting. Even though what is being rendered is as embarrassingly simple as possible there were some things I had to fix that weren’t behaving as I had intended. Until I saw the data visualized, however, I wasn’t aware that there were problems! I have also been using PIX for Windows, NSight, RenderDoc, and gpuview, but Tracy has really been useful in terms of presenting the information across multiple frames in a way that I can customize to see the relationships that I have wanted to see. I thought that it might be interesting to post about some of the issues with screenshots from the profiler while things are still simple and relatively easy to understand.
Visualizing Multiple Frames
Below is a screenshot of a capture from Tracy:
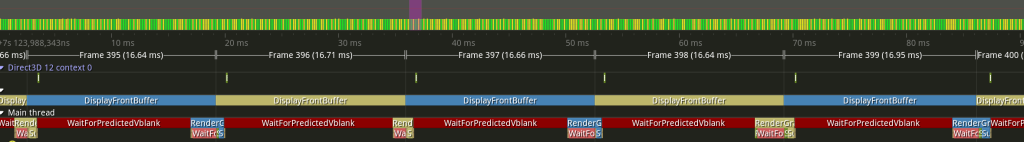
I have zoomed in at a level where 5 full frames are visible, with a little bit extra at the left and right. You can look for Frame 395, Frame 396, Frame 397, Frame 398, and Frame 399 to see where the frames are divided. These frame boundaries are explicitly marked by me, and I am doing so in a thread dedicated to waiting for IDXGIOutput::WaitForVBlank() and marking the frame; this means that a “frame” in the screenshot above indicates a specific frame of the display’s refresh cycle.
There is a second frame visualization at the top of the screen shot where there are many green and yellow rectangles. Each one of those represents the same kind of frames that were discussed in the previous paragraph, and the purple bar shows where in the timeline I am zoomed into (it’s hard to tell because it’s so small but there are 7 bars within the purple section, corresponding to the 1 + 5 + 1 frames visible at the level of zoom).
In addition to marking frames Tracy allows the user to mark what it calls “zones”. This is a way to subdivide each frame into separate hierarchical sections in order to visualize what is happening at different points in time during a frame. There are currently three threads shown in the capture:
- The main thread (which is all that my program currently has for doing actual work)
- An unnamed thread which is the vblank heartbeat thread
- GPU execution, which is not a CPU thread but instead shows how GPU work lines up with CPU work
I’ve highlighted those three threads in green in the screenshot below:
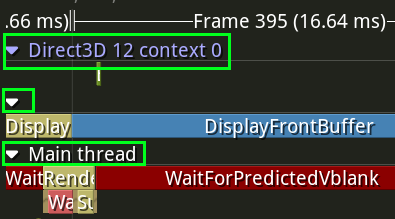
In order to try and help me make sure that I was understanding things properly I have color coded some zones specifically according to which swap chain texture is relevant. At the moment my swap chain only has two textures (meaning that there is only a single back buffer at any one time and the two textures just get toggled between being the front buffer or back buffer any time a swap happens) and they are shown with DarkKhaki and SteelBlue. In the heartbeat thread the DisplayFrontBuffer zone is colored according to which texture is actually being displayed during that frame (actually this is not true because of the Desktop Windows Manager compositor, but for the purposes of this post we will pretend that it is true conceptually).
I’ve highlighted the alternating colors of DisplayFrontBuffer for each frame in green in the screenshot below, which you can use to see which swap chain texture is being displayed during each frame:

I have used the same colors in the main CPU thread to show which swap chain texture GPU commands are being recorded and submitted for. In other words, the DarkKhaki and SteelBlue colors identify a specific swap chain texture, the heartbeat thread shows when that texture is the front buffer, and the main thread shows when that texture is the back buffer. At the current level of zoom it is hard to read anything in the relevant zones but the colors at least give an idea of when the CPU is doing work for a given swap chain texture before it is displayed.
I’ve highlighted the alternating colors of RenderGraphicsFrameOnCpu for each frame in green in the screenshot below, which you can use to see which swap chain texture will be modified during each frame:

Unfortunately for this post I don’t think that there is a way to dynamically modify the colors of zones in the GPU timeline (instead it seems to be a requirement that are known at compile time) and so I can’t make the same visual correspondence. From a visualization standpoint I think it would be nice to show some kind of zone for the present queue (using Windows terminology), but even without that it can be understood implicitly. I will discuss the GPU timeline more later in the post when things are zoomed in further.
With all of that explanation let me show the initial screenshot again:
Hopefully it makes some kind of sense now what you are looking at!
Visualizing a Single Frame
Let us now zoom in further to just look at a single frame:

During this Frame 326 we can see that the DarkKhaki texture is being displayed as the front buffer. That means that the SteelBlue texture is the back buffer, which is to say that it is the texture that must be modified so that it can then be shown during Frame 327.
Look at the GPU timeline. There is a very small OliveDrab zone that shows work being done on the GPU. That is where the GPU actually modifies the SteelBlue back buffer texture.
Now look at the CPU timeline. There is a zone called RenderGraphicsFrameOnCpu which is where the CPU is recording the commands for the GPU to execute and then submitting those commands (zones are hierarchical, and so the zones below RenderGraphicsFrameOnCpu are showing it subdivided even further). The color is SteelBlue, and so these GPU commands will modify the texture that was being displayed in Frame 395 and that will again be displayed in Frame 397. You may notice that this section starts before the start of Frame 396, while the SteelBlue texture is still the front buffer and thus is still being displayed! In order to better understand what is happening we can zoom in even further:

Compare this with the previous screenshot. This is the CPU work being done at the end of Frame 365 and the beginning of Frame 366, and it is the work that will determine what is displayed during Frame 367.
The work that is done can be thought of as:
- On the CPU, record some commands for the GPU to execute
- On the CPU, submit those commands to the GPU so that it can start executing them
- On the CPU, submit a swap command to change the newly-modified back buffer into the front buffer at the next vblank after all GPU commands are finished executing
- On the GPU, execute the commands that were submitted
It is important that the GPU doesn’t start executing any commands that would modify the SteelBlue swap chain texture until that texture becomes the back buffer (and is no longer being displayed). The WaitForSwap zone shows where the CPU is waiting for the swap to happen before submitting the commands (which triggers the GPU to start executing the commands). There is no reason, however, that the CPU can’t record commands ahead of time, as long as those commands aren’t submitted to the GPU until the SteelBlue texture is ready to be modified. This is why the RenderGraphicsFrameOnCPU zone can start early: It records commands for the GPU (you can see a small OliveDrab section where this happens) but then must wait before submitting the commands (the next OliveDrab section).
How early can the CPU start recording commands? There are two different answers to this, depending on how the application works. The simple answer (well, “simple” if you understand D3D12 command allocators) is that recording can start as soon as the GPU has finished executing the commands that were previously submitted that were saved in the memory that the new recording is going to reuse. There is a check for this in my code that is so small that it can only be seen if the profiler is zoomed in even further
I’ve highlighted the WaitForGpuToReachSwap zone in green in the screenshot below, which shows where the CPU made sure that it was ok to start recording commands for the GPU:

The reason that this wait is so short is because the GPU work being done is so simple that it reached the submitted swap long before the CPU checked to make sure.
I’ve highlighted the path from submitting GPU commands on the CPU to executing GPU commands to waiting for GPU commands to finish executing on the CPU in green in the screenshot below:

Do you see that long line between executing the GPU commands and then recording new ones on the CPU? With the small amount of GPU work that my program is currently doing (clearing the texture and then drawing two quads) there isn’t anything to wait for by the time I am ready to start recording new commands.
If you’ve been following you might be asking yourself why I don’t start recording GPU commands even sooner. Based on what I’ve explained above the program could be even more efficient and start recording commands as soon as the GPU was finished executing the previous commands, and this would definitely be a valid strategy with the simple program that I have right now:
This is a capture that I made after I modified my program to record new GPU commands as soon as possible. The WaitForPredictedVblank zone is gone, the WaitForGpuToReachSwap zone is now visible at this level of zoom, and the WaitForSwap zone is now bigger. The overlapping of DarkKhaki and SteelBlue is much more pronounced because the CPU is starting to work on rendering a new version of the swap chain texture as soon as that swap chain texture is displayed to the user as a front buffer (although notice that the commands still aren’t submitted to the GPU until after the swap happens and the texture is no longer displayed to the user). Based on my understanding this kind of scheduling probably represents something close to the ideal situation if 1) a program wants to use vsync and 2) knows that it can render everything fast enough within one display refresh and 3) doesn’t have to worry about user input.
The next section explains what the WaitForPredictedVblank is for and why user input makes the idealized screenshot above not as good as it might at first seem.
When to Start Recording GPU Commands
Earlier I said that there were two different answers to the question of how early the CPU can start recording commands for the GPU. In my profile screenshots there is a DarkRed zone called WaitForPredictedVblank that I haven’t explained yet, but we did observe that it could be removed and that doing so allowed even more efficient scheduling of work. This WaitForPredictedVblank zone is related to the second alternate answer of when to start recording commands.
I’ve highlighted the WaitForPredictedVblank zone in green in the screenshot below:
My end goal is to make a game, which means that the application is interactive and can be influenced by the player. If my program weren’t interactive but instead just had to render predetermined frames as efficiently as possible (something like a video player, for example) then it would make sense to start recording commands for the GPU as soon as possible (as shown in the previous section). The requirement to be interactive, however, makes things more complicated.
The results of an interactive program are non-deterministic. In the context of the current discussion this can be thought of as an additional constraint on when commands for the GPU can start being recorded, which is so simple that it is kind of funny to write out: Commands for the GPU to execute can’t start being recorded until it is known what the commands for the GPU to execute should be. The amount of time between recording GPU commands and the results of executing those commands being displayed has a direct relationship to the latency between a user providing input and the user seeing the result of that input on a display. The later that the contents of a rendered frame are determined the less latency the user will experience.
All of that is a long way of explaining what the WaitForPredictedVblank zone is: It is a placeholder in my engine for dealing with game logic and simulation updates. I can predict when the next vblank is (see the Syncing without VSync post for more details), and I am using that as a target for when to start recording the next frame. Since I don’t actually have any work to do yet I am doing a Sleep() in Windows, and since the results of sleeping have limited precision I only sleep until relatively close to the predicted vblank and then wait on the more reliable swap chain waitable object (this is the WaitForSwap zone):

(Side note: Being able to visualize this in the instrumented profile gives more evidence that my method of predicting when the vblank will happen is pretty reliable, which is gratifying.)
The next step will be to implement simulation updates using fixed timesteps and then record GPU commands at the appropriate time, interpolating between the two appropriate simulation updates. That will remove the big WaitForPredictedVblank, and instead there will be some form of individual simulation updates which should be visible.
Conclusion
If you’ve made it this far congratulations! I will show the initial screenshot one more time, showing the current state of my engine’s rendering and how work for the GPU is scheduled, recorded, and submitted:
There is a follow-up post about adding simulation frames here.